 The South Jersey Shore real estate market saw the number of homes sold decline in March, according to the Long & Foster Market Minute reports. The South Jersey Shore market includes Atlantic and Cape May counties. The Long & Foster Market Minute reports are based on data provided by the South Jersey Shore and Cape May County multiple listing services and their member associations of Realtors and include residential real estate transactions within specific geographic regions, not just Long & Foster sales.
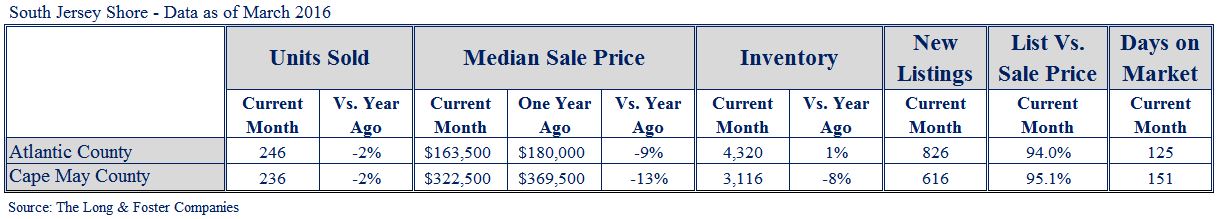
When compared to the same month in 2015, the number of units sold in the South Jersey Shore region decreased, falling by 2 percent in both Atlantic and Cape May counties. Median sale prices also declined in the area compared to March 2015, with Atlantic County seeing a 9 percent decrease and Cape May County seeing a 13 percent decline.
In Cape May County, active inventory decreased by 8 percent, while it increased by 1 percent compared to the previous year in Atlantic County. The days on market (DOM) average for Atlantic County was 125 days and Cape May County saw a DOM average of 151 days.
“The real estate market has been off to a good start this year and although low inventory has impacted many areas, homes are continuing to sell at a steady pace, including in the south Jersey Shore region,” said Jeffrey S. Detwiler, chief operating officer of The Long & Foster Companies. “Across Long & Foster’s markets we’ve seen modest overall growth in sales in the first quarter of 2016 and we expect to see even more positive trends in the months ahead.”
The Long & Foster Market Minute is an overview of market statistics based on residential real estate transactions and presented at the county level. The easy-to-read and easy-to-share reports include information about each area’s units sold, active inventory, median sale prices, months of supply, new listings, new contracts, list to sold price ratio, and days on market. Featuring reports for more than 500 local areas and neighborhoods in addition to more than 100 counties in eight states, The Long & Foster Market Minute is offered to buyers and sellers as they aim to make well-informed real estate decisions.
The Long & Foster Market Minute reports are available at www.LongandFoster.com, and you can subscribe to free updates for the reports in which you’re interested. Information included in this report is based on data supplied by SJS and CMC, which is not responsible for its accuracy. The reports do not reflect all activity in the marketplace. Information contained in this report is deemed reliable but not guaranteed, should be independently verified, and does not constitute an opinion of SJS, CMC or Long & Foster Real Estate, Inc.