 Long & Foster Real Estate, the largest independent residential real estate company in the United States, has updated its neighborhood level versions of The Long & Foster Market Minute for 15 areas within Washington, D.C.
Overall, Washington, D.C., experienced a year-over-year increase in the number of homes sold and a decrease in median sale price in June. Active inventory fell by 12 percent in Washington, D.C., compared to the same month in 2013. June data also shows that in most neighborhoods homes are selling in a little over three weeks on average. Many individual neighborhoods in the city, however, continued to outperform the District as a whole.
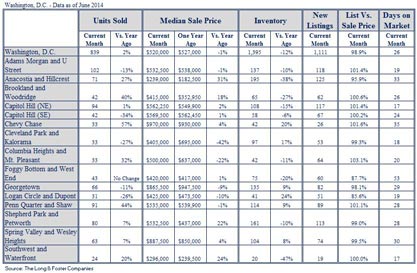
Across the city, the number of homes sold in June increased by 2 percent year-over-year, although many individual neighborhoods experienced greater increases. For example, the Chevy Chase neighborhood saw a large 57 percent increase in number of units sold and the Penn Quarter and Shaw neighborhood experienced a 44 percent increase. The Brookland and Woodridge neighborhood followed with a 40 percent increase in the number of units sold.
According to June data, median sale price in Washington, D.C., decreased by 1 percent overall compared to the same month in 2013, but several neighborhoods saw increases in median sale price. The Anacostia and Hillcrest neighborhood saw the largest increase at 31 percent. The Southwest and Waterfront neighborhood saw a 24 percent increase. The Shepherd Park and Petworth neighborhood experienced a 22 percent increase in median sale price.
Active inventory decreased by 12 percent throughout the city in June. The Southwest and Waterfront neighborhood saw a 47 percent decrease in active inventory. The Anacostia and Hillcrest neighborhood experienced a 38 percent decrease in active inventory, while the Brookland and Woodridge neighborhood saw a 27 percent decrease.
In June, the District experienced a days on market (DOM) average of 26 days. The Capitol Hill (NE), and Southwest and Waterfront neighborhoods both experienced a marketing period of 17 days. The Cleveland Park and Kalorama neighborhood followed closely behind with a DOM of 18 days, and the neighborhoods of Adams Morgan and U Street, and Logan Circle and Dupont saw DOMs of 19 days.
“We’re now halfway through 2014, and this year has brought many positive developments like increasing sale prices and quick home sales,” said Jeffrey S. Detwiler, president and chief operating officer for The Long & Foster Companies. “Overall, the market is stabilizing and that will help keep the industry healthy and ready for future growth.”
The Long & Foster Market Minute is an overview of market statistics based on residential real estate transactions and presented at the county level. The easy-to-read and easy-to-share reports include information about each area’s units sold, active inventory, median sale prices, months of supply, new listings, new contracts, list to sold price ratio, and days on market. Featuring reports for more than 500 local areas and neighborhoods in addition to more than 100 counties in eight states, The Long & Foster Market Minute is offered to buyers and sellers as they aim to make well-informed real estate decisions.
The Long & Foster Market Minute reports are available at www.LongandFoster.com, and users can subscribe to free updates for the reports in which they’re interested.